Profiling for Android
Getting Started
Profiling your web applications is just as important as profiling your native applications. In order to profile your web applications running inside of Portals, you need to open Google Chrome.
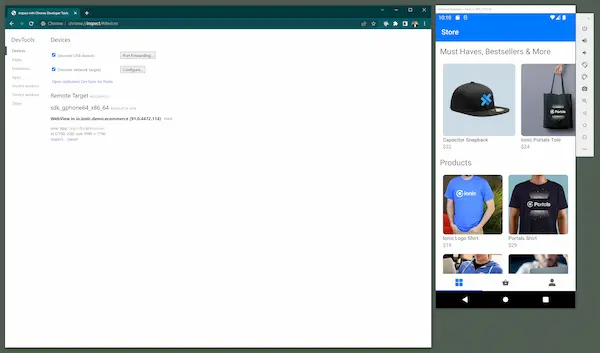
Next, navigate to "chrome://inspect" to view a list of target devices to inspect. If your connected device or emulator is running an application containing a Portal, it will display here when loaded.
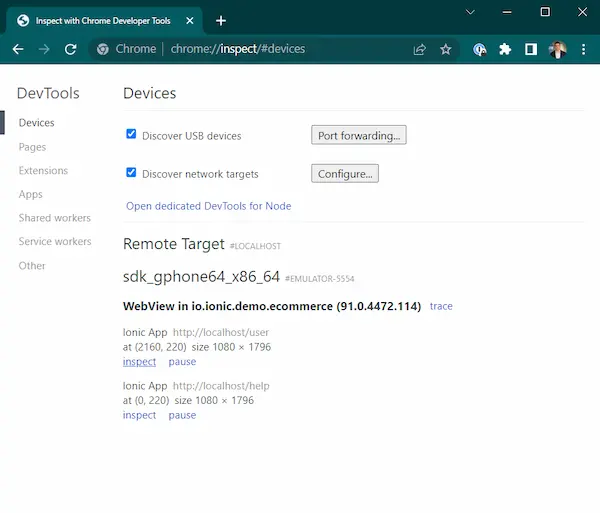
You may see more than one web application displayed in the menu for the application you're debugging. Click the "inspect" link for the item in the list that corresponds to the Portal you wish to debug.
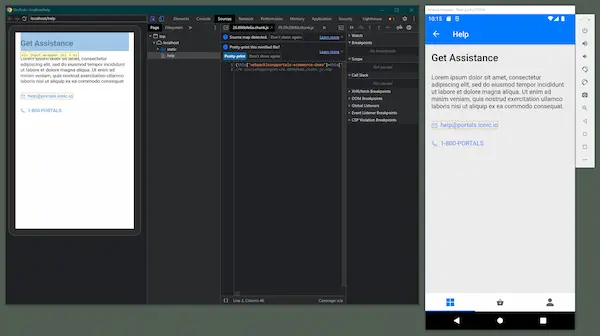
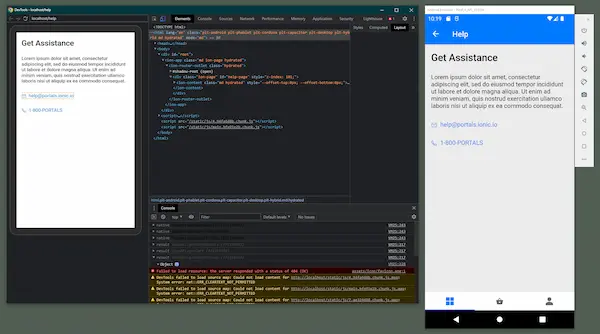
Elements
Select the "Elements" tab to view the contents of the page in more detail. Here you can drill down into the rendered HTML on screen and inspect CSS.
Network
Another tab of interest is "Network". To see the time it takes to load the files from disk, you can click the red circle button for "Record", then press CTRL+R to reload the page ignoring the cache.
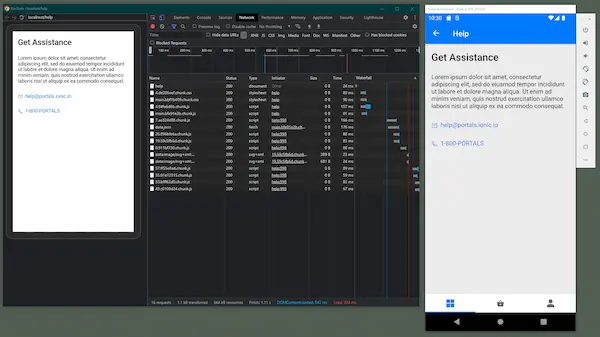
Most of the data in the network tab is likely going to be a combination of html, css, and js. The data points for these bits is likely not going to be of much interest since all of these files are loading from disk and should not take long to load.
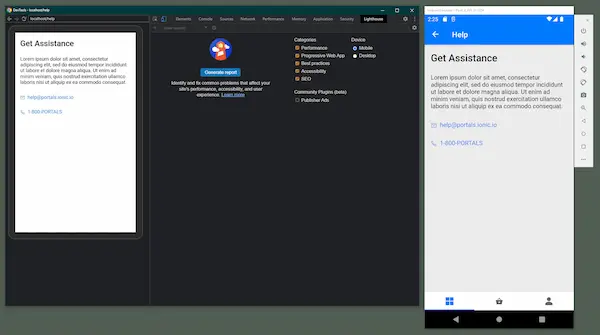
Lighthouse
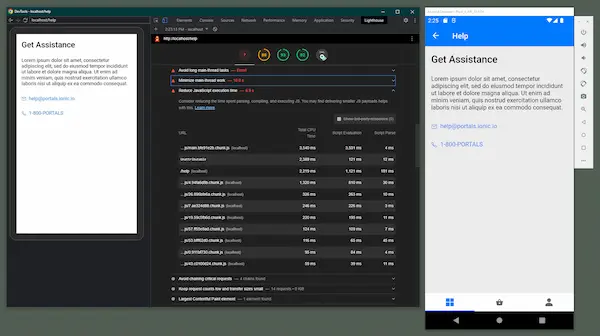
One of the more useful features of the Chome DevTools is Lighthouse. Similar to the Network tab, you can click the "Generate report" button to reload the page ignoring the cache to start a Lighthouse report.
Once the report is finished, you can review the findings for help troubleshooting performance issues in your web app.
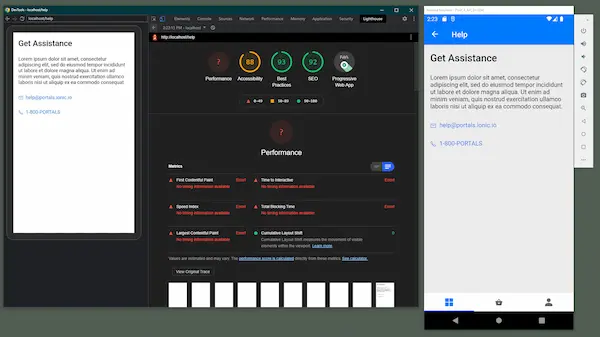
If load time is a trouble for your app, you can dig into the results to find which content may be causing slowness.
Lighthouse Export
It may be neccessary to share a Lighthouse report with others, such as the web developers who wrote the code being profiled. To export the Lighthouse report data, click the dot menu button in the top right of the report to view export options.
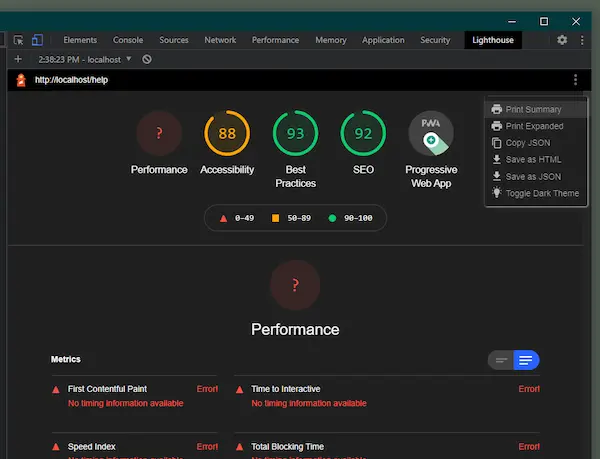
Selecting the option to "Print Expanded" will create a printable expanded report that can be saved and shared as a PDF. Saving as HTML will allow the report to be shared and viewed in any web browser.
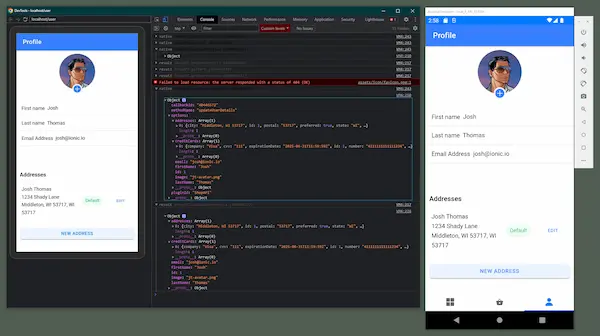
Console
The console can provide so additional insight into the behavior of a Portal application. Any communication that occurs across the web/native boundary will be present in the console. The detail will be collapsed initially.
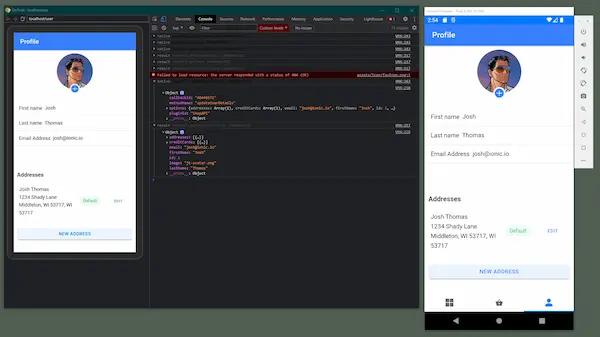
To view the detail, click on the indicator arrows to expand the data.