Profiling for iOS
Getting Started
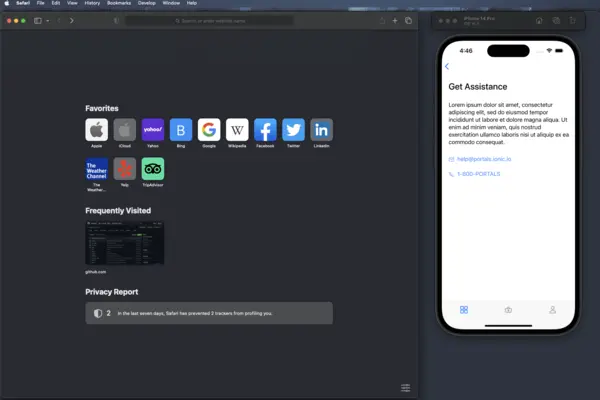
Profiling your web applications is just as important as profiling your native applications. In order to profile your web applications running inside of Portals, you need to open Safari.
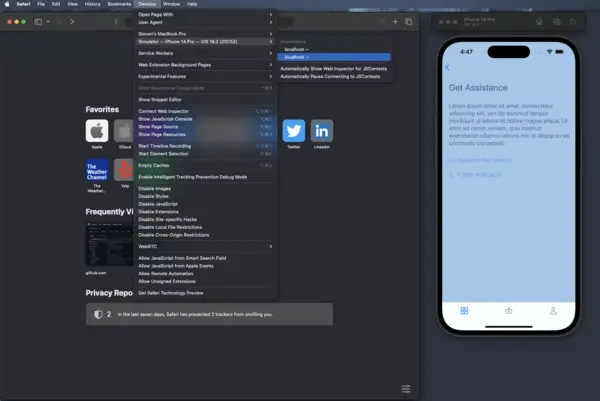
Next, click on the "Develop" menu item. If you do not have a "Develop" menu item available, follow the official Apple documentation to get set up.
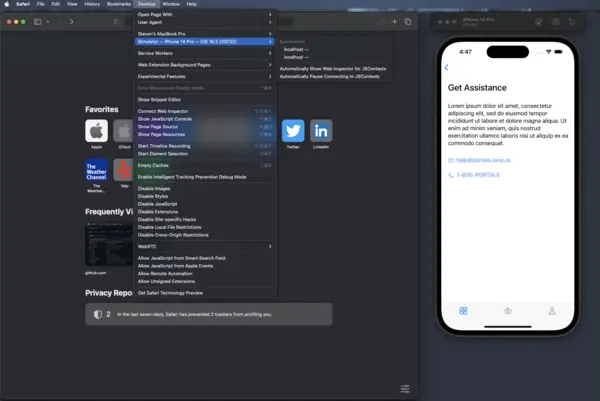
You may see more than one web application displayed in the menu for the application you're debugging. Click the item in the list when the web content is highlighted when you hover over it.
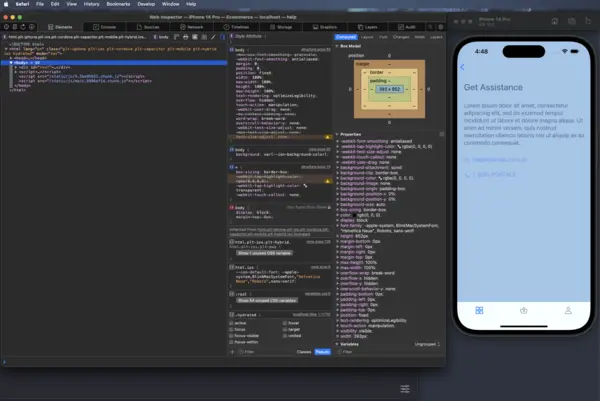
Elements
If you have never opened Safari developer tools before, it should open on the "Elements" tab. Here you can drill down into the rendered HTML on screen and inspect CSS.
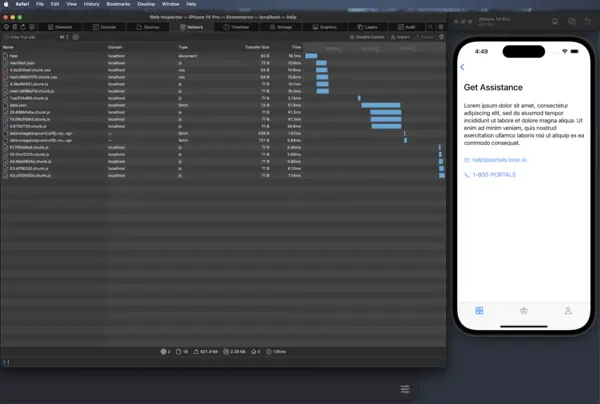
Network
Another tab of interest is "Network". To see the time it takes to load the files from disk, you can click the "Reload" button, press ⌘R, or ⌥⌘R to reload the page ignoring the cache.
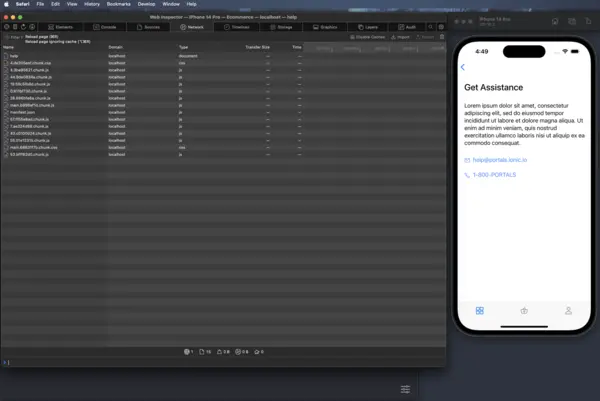
Most of the data in the network tab is likely going to be a combination of html, css, and js. The data points for these bits is likely not going to be of much interest since all of these files are loading from disk and should not take long to load. However, if your web team is not using the CapacitorHttp plugin and any network requests occur in your page interactions, you will see those network requests in this tab as well.
Timeline
One of the more useful features of Safari Dev Tools is the Timeline. Similar to the Network tab, you can click the "Reload" button, press ⌘R, or ⌥⌘R to reload the page ignoring the cache to start recording the Timeline.
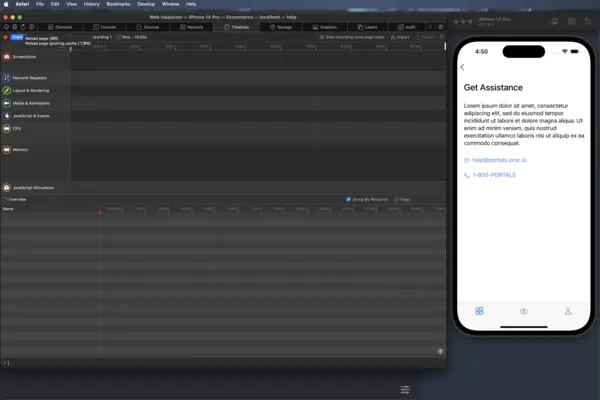
The timeline will continue to record until you click the stop button.
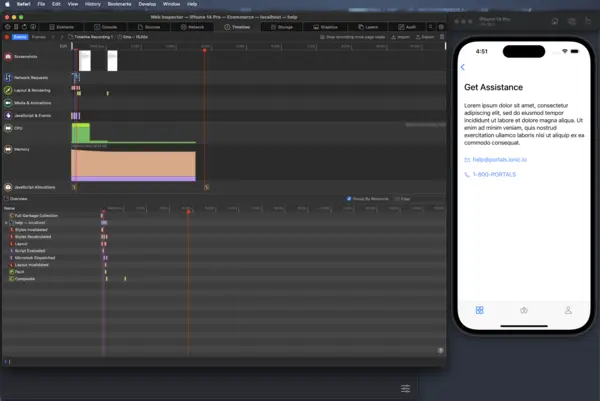
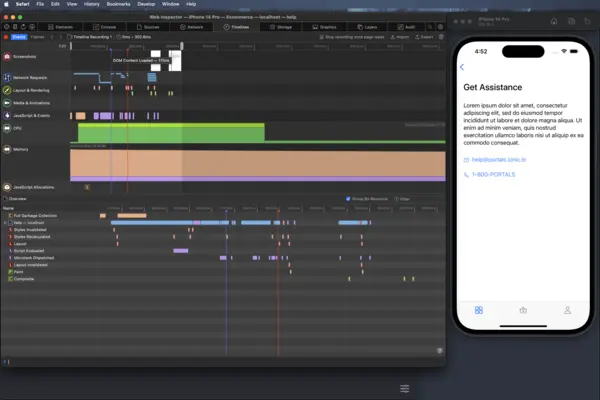
Once the timeline is finished recording, you can zoom in and slice the parts of the timeline that are of interest.
Native Http Caveat
Due to a limitation in Safari Dev Tools, if the web application uses CapacitorHttp you will not get any insight into how those requests may be impacting your application performance in the timeline tab. Starting in Capacitor 4.6.3, a total time for the network request will be logged out to the console. This is not an issue for Android developers debugging their web applications in Chrome.
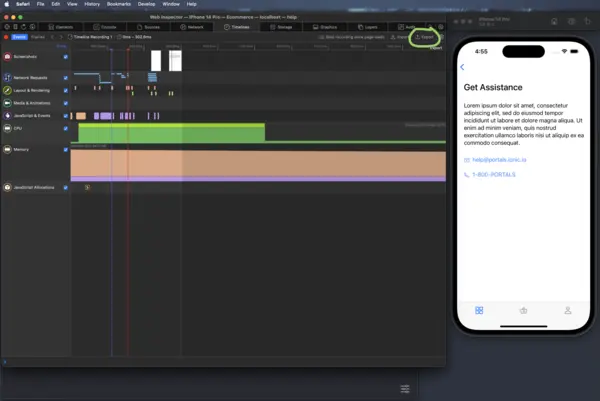
Timeline Export
It may be neccessary to share recorded timeline data with others, such as the web developers who wrote the code being profiled. To export the timeline data, click the export button at the top right corner of the Timeline tab.
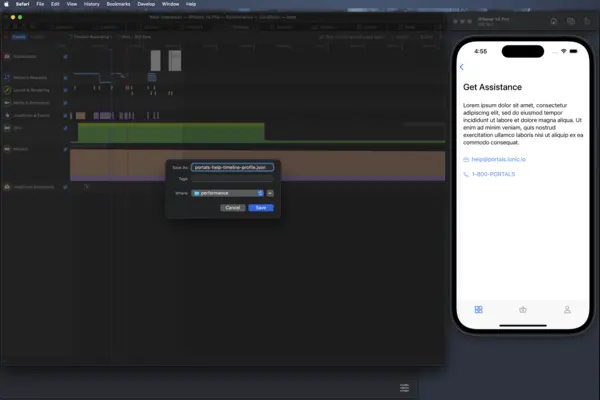
Save the data to disk.
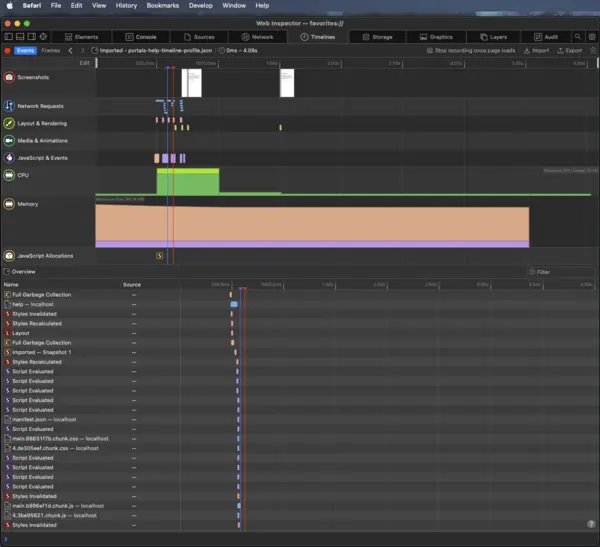
Timeline Import
To import the timeline data, click the "Import" button to the left of the export button in the top right corner of the timeline tab and select the appropriate file.
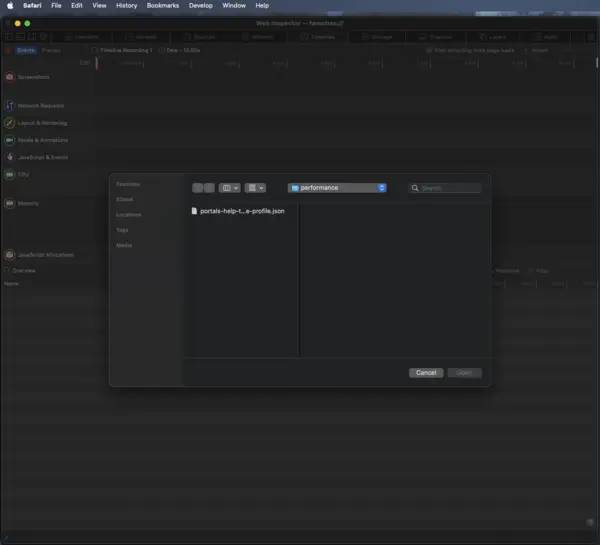
Once loaded, the timeline can be inspected as normal.
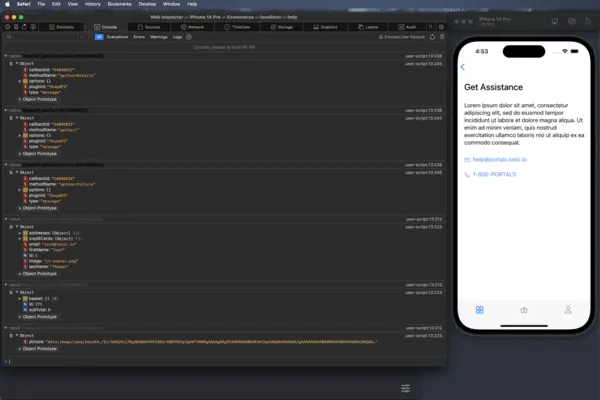
Console
The console can provide so additional insight into the behavior of a Portal application. Any communication that occurs across the web/native boundary will be present in the console. The detail will be collapsed initially.
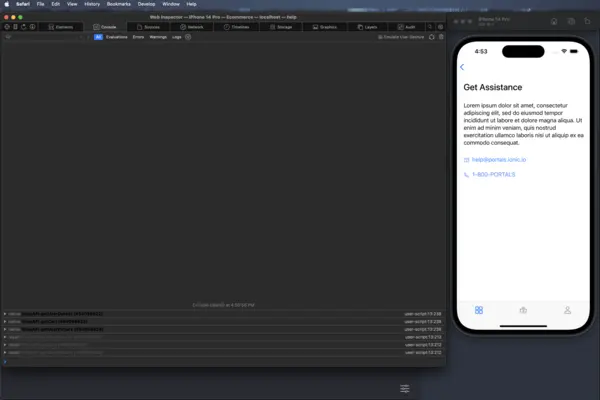
To view the detail, click on the indicator arrows to expand the data.